Developing a system for finding alternative ways of visualizing data

Please contact Yuri Engelhardt for information about the different possibilities within this general theme.
Data (of any kind) relating to geographic entities such as municipalities, provinces or countries (which may be available for different moments in time), can be represented through maps, but also through many other kinds of visualizations. See for example the DataVizProject for a useful inventory of 154 different types of visualization. When visualizing a given data set, the full and diverse spectrum of potentially appropriate visualizations unfortunately often remains largely unexplored. The aim of this MSc research project will be to develop a system that makes it possible – depending on a given combination of data types and/or on a given type of visualization – to suggest (other) potentially appropriate types of visualization for representing the same data.

Objectives:
- Exploring the broad spectrum of different types of visualization and developing a systematic way to suggest possible designs, for any given data types/combinations.
- Analyzing the relationships between different chart types.
Possible steps or sub-projects of this research project may include any of the following:
- Making an inventory of the different chart types that can be used to visualize information relating to geographic entities, for example by examining the visualizations in the World Bank’s SDG Atlas, and analyzing which of these chart types can be used for which combinations of data.
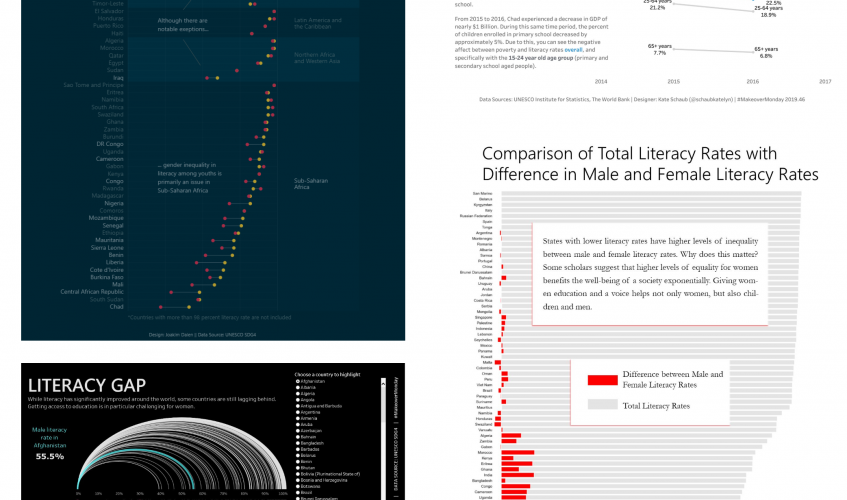
- Analyzing makeovers – different visualizations based on the same data set – to systematically investigate the possibilities for representing the same data using different chart types, for example by examining the Makeover Monday visualizations.
- Analyzing how different chart types (e.g. as listed in the DataVizProject) are related, in terms of similarities and differences regarding their ‘building blocks’ (different visual encodings and different types of visual components) and regarding the way that these building blocks are combined (in the sense that has been described as the ‘DNA of visualization’ framework by Engelhardt and Richards).
- Conceptually developing, based on the above investigation(s), a system for suggesting alternative types of visualization, depending on a given type of visualization and/or on a given combination of data types.
- implementing such a system as a functioning computer-based ‘chart type suggestion tool’ (prototype).
