Annotations for the paper and online ITC atlas
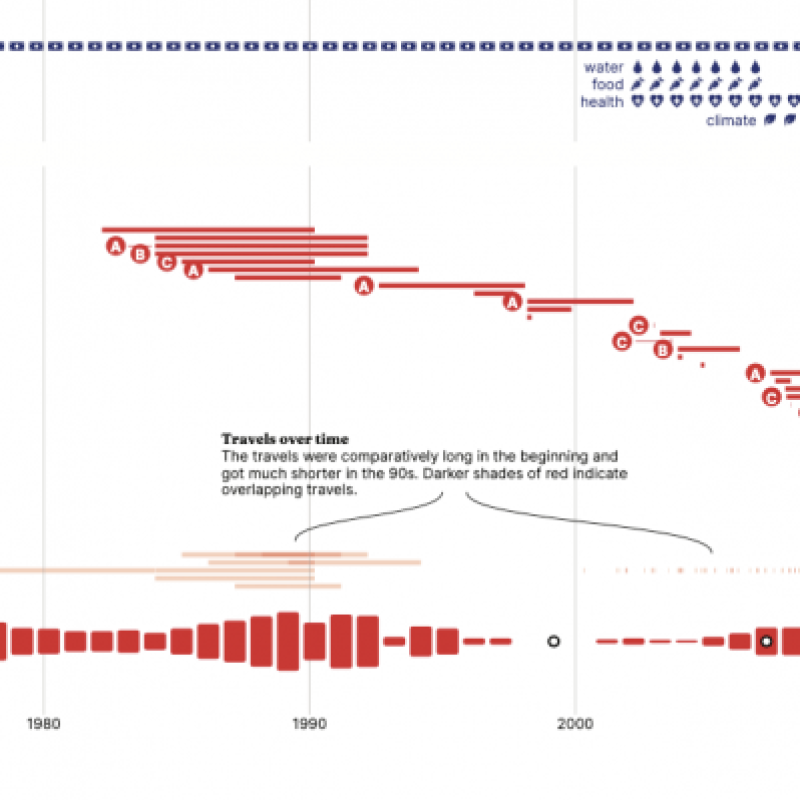
Annotations in an interactive atlas environment will support the user to execute atlas tasks, and help them to better understand what they see in respect to the (carto)graphic representations used, the data behind the maps and diagrams, and to explain the patterns visible. In addition the annotations can be helpful to inform about alternative visualizations and their impact.
How can these different annotations (annotate the data, the pattern, and the cartographic representation) be applied in both the paper and online version of an atlas. Here we specifically look at the Atlas of the world of ITC - The impact of capacity development. This atlas is currently being developed and created. Your work will be part of the final product.
To design and and implement an approach that allow the use of annotations in both paper and online atlases use the strengths of both media.
-
Ren, D, et al (2017) ChartAccent: Annotation for data-driven storytelling https://ieeexplore.ieee.org/document/803159
-
Roth, R. (2020) Cartographic Design as Visual Storytelling: Synthesis and Review of Map-Based Narratives, Genres and Tropes. The Cartographic Journal. DOI:10.1080/00087041.2019.1633103
-
https://www.ordnancesurvey.co.uk/blog/2018/03/annotations-adding-narrati...
http://www.visualisingdata.com/2017/06/little-visualisation-design-part-38/
https://www.data-to-viz.com/caveat/annotation.html

