Linked Complementary Globes
This project will have the student build multi-globe visualizations in one or more mediums: on desktop computer screens, in virtual reality or augmented reality. They must also build corresponding flat map versions of the same visualizations. Development will likely make use of either Cesium (https://cesium.com/) or NASA WorldWind (https://worldwind.arc.nasa.gov/), but any supporting platforms could be substituted for these if necessary or desired. The student will also collect and curate interesting global thematic datasets to visualize on their globes and flat maps using thematic map types, such as choropleths, bar-height maps, isopleths, etc. A user study will also have to be developed and executed in order to gather data on the differences in usability between flat and globe viewing environments, and these data will need to be analysed and synthesized.
Research will involve:
- Reviewing literature about globes, world maps, and projection-related perception distortions.
- Building an app with linked, complementary views of the Earth using multiple virtual globes and corresponding flat map versions.
- Designing a testing scheme using user experience data-collecting methods such as survey, talk-aloud, eye tracking, etc.
- Recruiting participants and conducting user testing.
Skill sets for a student undertaking this research include:
- Survey and interview design;
- Basic computer programming/scripting skills (likely JavaScript and web development, possibly other languages).
- Basic statistical analysis.
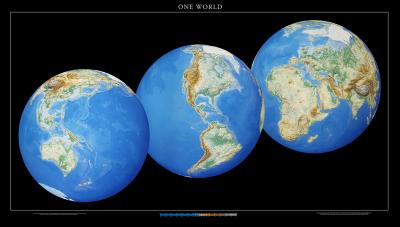
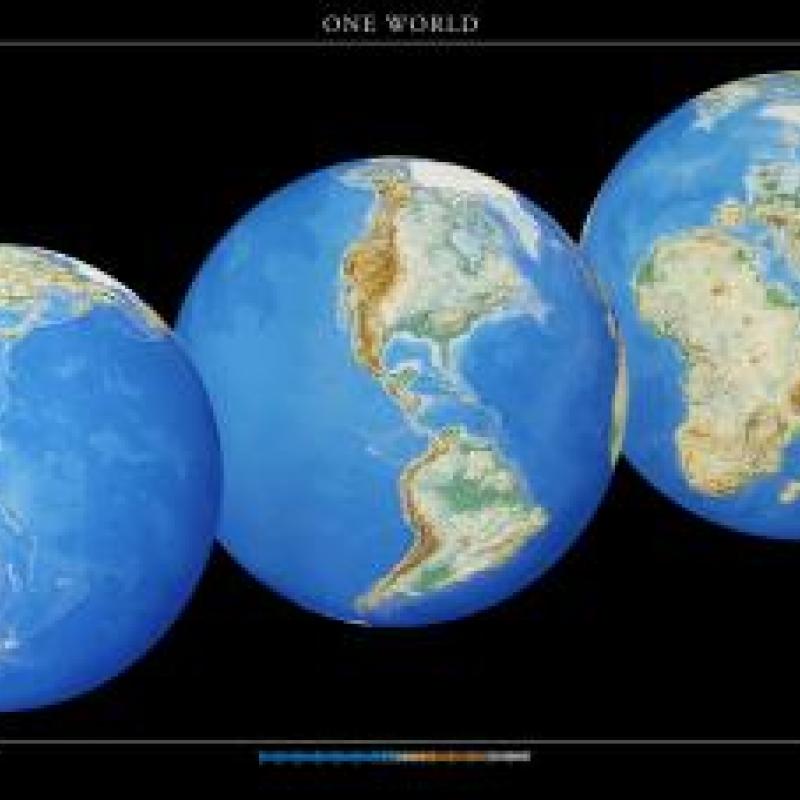
https://www.ravenmaps.com/one-world-1949.html
An orthographic view of a globe is a relatively undistorted view of Earth's geography, but the whole surface cannot be seen synoptically at once: the viewer must rotate the globe to see parts of the planet hidden from view. This topic proposes the use of three or more globes in an interactive, linked visualization, such that the various globes each face the viewer in different perspectives and, across them all, allow the whole of the Earth's surface to be seen at any one time in the visualization. The research involved would be to build such a visualization using virtual globes, and to test this method against the use of a flat world map for clarity in viewing thematic maps with human experiment participants.
-
Satriadi, K. A., Smiley, J., Ens, B., Cordeil, M., Czauderna, T., Lee, B., Yang, Y., Dwyer, T., & Jenny, B. (2022). Tangible Globes for Data Visualisation in Augmented Reality. Proceedings of the 2022 CHI Conference on Human Factors in Computing Systems, 1–16. https://doi.org/10.1145/3491102.3517715
-
Blaschke, T., Donert, K., Gossette, F., Kienberger, S., Marani, M., Qureshi, S., & Tiede, D. (2012). Virtual Globes: Serving Science and Society. *Information*, 3(3), 372–390. https://doi.org/10.3390/info3030372
-
Butler, D. The web-wide world. *Nature* 439, 776–778 (2006). https://doi.org/10.1038/439776a