Dynamic Area Frames for improved Crop Production Estimation
A suitable candidate is the one who is keenly interested in Food Security and who has an agricultural background and keen RS/GIS-based future career plans.
For Orisha, India, the Forages-group is building a comprehensive geo-database of imagery and agricultural (land-use) statistics. By CPSZ (22x) for crops that are typically grown there, the “when” (season-specific) needs to be further defined (CPSZ-specific crop calendars), and by using those and by preparing “dynamic-frames”, seasonal differences in performance, must be studied to prove the value of using dynamic frames for generating yearly updates of agricultural production statistics.
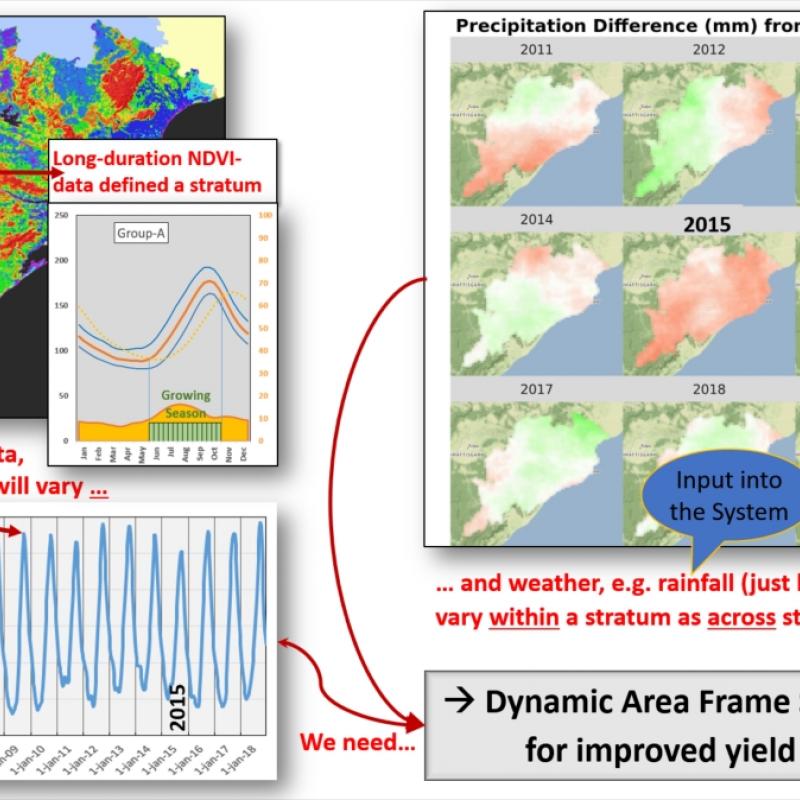
Advanced Agro-Ecological Zoning was carried out through clustering pixel-specific long-duration (20-years) temporal NDVI-profiles (greenness-profiles) for the whole Orisha area. We labelled the created zones (22x): Crop Production System Zones (CPSZs). These are zones with internally (between 1km2 grids) relative homogeneous land cover and land use patterns (patterns of mosaics and complexes), while between them, those patterns substantially differ. It mapped the relevant different “statistical populations” that matter when generating agricultural area statistics. Recognizing their existence is typically missing, when following traditional sampling schemes organized on an administrative areas basis. Once, agricultural area statistics by CPSZ are collected, they can be shown as a map and re-assembled in tables to create reports by admin.areas (properly weighed by CPSZs extent).
Where the above zonation is rather static (more climate based), frequent season-specific differentiations can occur ‘within’ a CPSZ through weather anomalies. Weather variability patterns of rainfall differences from normal or occurrence of heat stress, are typically measured at landscape level, but occur mostly following larger weather system patterns. As a result, the ‘weather anomaly map’ must be draped over the CPSZ-map, to create a representative sampling scheme that includes for each relevant CPSZ the occurring relevant weather anomaly classes. This will map a 2nd order of “statistical populations” that matter when generating agricultural performance (yield) statistics.